Add graph on bridge users by country and transport
The following idea came up in the discussion to provide "users-per-transport-per-country" statistics for obfsbridges. This ticket is about graphing existing data, whereas the discussion of reporting new data will continue on legacy/trac#10218 (moved). Quoting a bit from that ticket to have enough context here:
It turns out that most large bridges (4 out of 5 on February 1, 2016) only see noteworthy usage via a single transport or have requests via one transport dominating the others in numbers (74% on the 5th large bridge on February 1, 2016).
We could assume that the distribution by country is the same for all transports, that is, if
CC(in[0..1]) requests came from a given country andPT(also in[0..1]) requests came in via a given transport,x * yrequests can be attributed to that country and transport. But that assumption may be wrong.What we could also do as first approximation is find a lower and upper bound of users by country and transport. The lower bound would probably be defined as something like
max(0, PT + CC - 1)(not just0to account for cases whereCC > 1 - PT) and the upper bound asmin(PT, CC), even though I could be convinced that other formulas are even more correct.
dcf kindly graphed responses by country and transport on legacy/trac#10218 (moved) here and here, indicating that this approach may produce actually useful results.
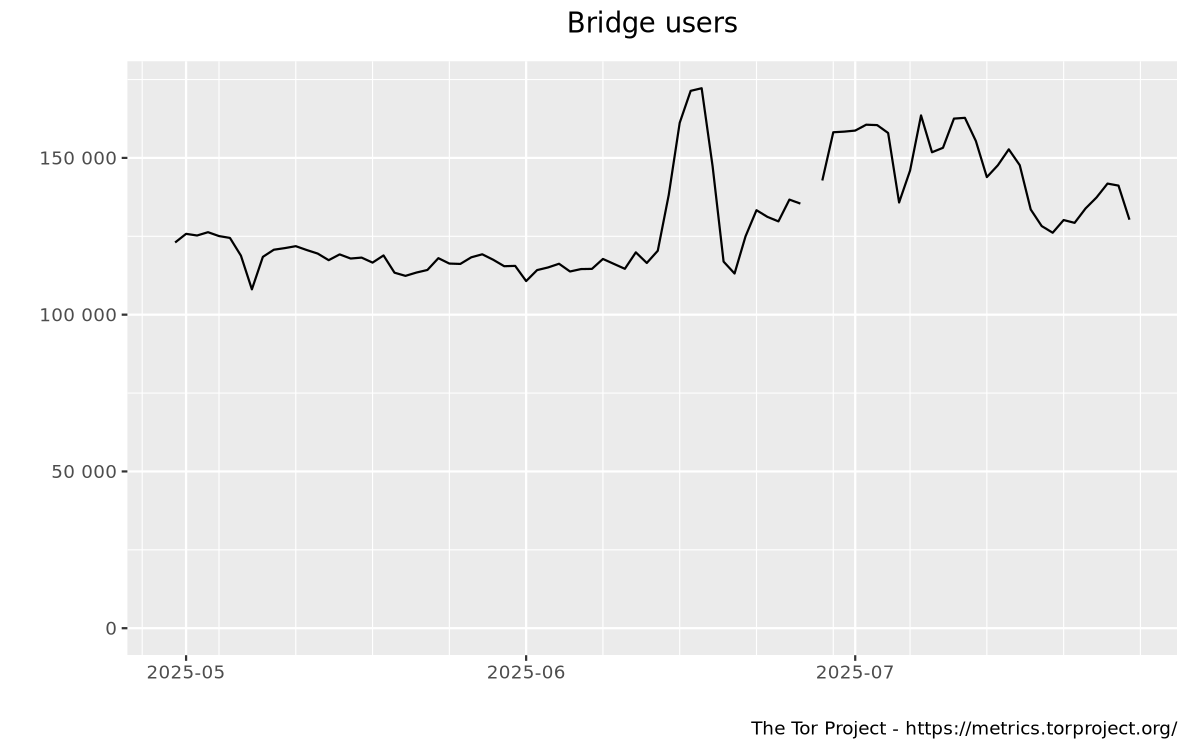
The next step was to perform these calculations in the database and transform number of responses to estimated user numbers. I finally found time to work on that step. Here's a graph on Tor Metrics which is yet "hidden" under "Advanced" until I'm more confident that it's doing the right thing.
https://metrics.torproject.org/userstats-bridge-combined.html
Example (image link to that graph, may look different over time):
Next steps:
-
Become more confident in the particular math and code behind this graph. Once that's done, move the graph to "Basic" so that people will find it. I'm attaching a branch in a minute.
-
Make the user interface better. For example, we could also graph top countries by transport, not just top transports by all countries or top transports in a given country. Maybe we can graph other things using this data as well.
-
Make the raw data available. There's a .csv file behind this graph, but I didn't put that on Tor Metrics yet, because we might have to change the data format and lack a versioning system to do that. I'm putting up a snapshot of that file (36.4M) for review.