replace "Tor VM hosts" spreadsheet with Grafana dashboard
Our KVM allocation strategy is currently managed through a Google spreadsheet. This is suboptimal for a few reasons:
-
it is hard to keep up to date - for example, moly is not listed in there even though it's in LDAP as a "KVM host"
-
it's not real time data - for example, even if a host is allocated one vCPU, it might be totally idle most of the time and doing mostly network or disk, while another one might hit the CPU hard. actual load is what matters
-
it's hosted by Google - that has a few problems, the most important of which is that some TPA do not actually want to use Google services and might be reluctant to update it, worsening problem 1that part is fixed: we have moved it to Nextcloud
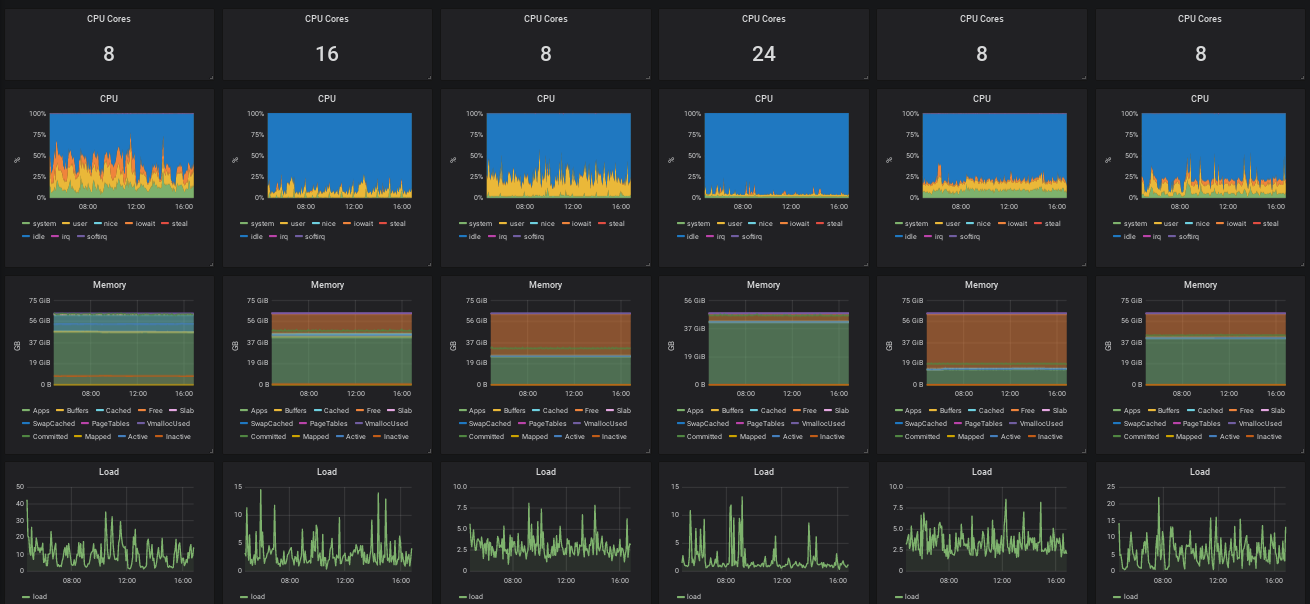
I propose we shift this to a Grafana dashboard. I already have a prototype in the form of the Node exporter server metrics Grafana Dashboard which shows multiple hosts basic stats in parallel. I set the default of the dashboard in Grafana to show the 6 KVM hosts:
That looks like this:
.. but it's not ideal:
-
it's showing irrelevant stats for this purpose like context switches or detailed disk or memory stats
-
it's missing critical information like the number of KVM guests hosted on the machine, how many CPUs and disk space is allocated and so on
This is the information we should be showing:
- disk capacity vs allocation
- disk utilization
- CPU count vs allocation
- actual CPU utilization
- load?
- memory capacity vs allocation
- actual memory usage
Some of that information currently lives only in the spreadsheet. For example, disk allocations are only available there, as the KVM guests run on QCOW (Qemu Copy On Write) filesystems that only take space when actually used by the guest. This has the advantage of allowing us to over-provision, but means we must keep that metadata somewhere else.
So for now it's in the spreadsheet, but we could find a way to move it somewhere Prometheus can scrape. One trick that Prometheus has is that it can expose metrics stored as text files in /var/lib/prometheus/node-exporter/*.prom. This is how the smartctl and APT metrics get shipped for example: a cron job (well, a systemd timer) regularly writes that file, atomically. So one option could be to move this information to (say) LDAP or Puppet/Hiera and write that information into that file using a cronjob (LDAP) or Puppet (Hiera).
Then we'd build a custom Grafana dashboard and get rid of the other spreadsheet.
A stop-gap measure might be to simplify the spreadsheet and move it to a plain text markdown file. We would lose the automatic calculations the spreadsheet provide, in exchange for easier updating and transparency.
