High availability Prometheus monitoring
In TPA-RFC-33, we have proposed (and adopted) the idea that we should have a pair of highly available, redundant monitoring servers.
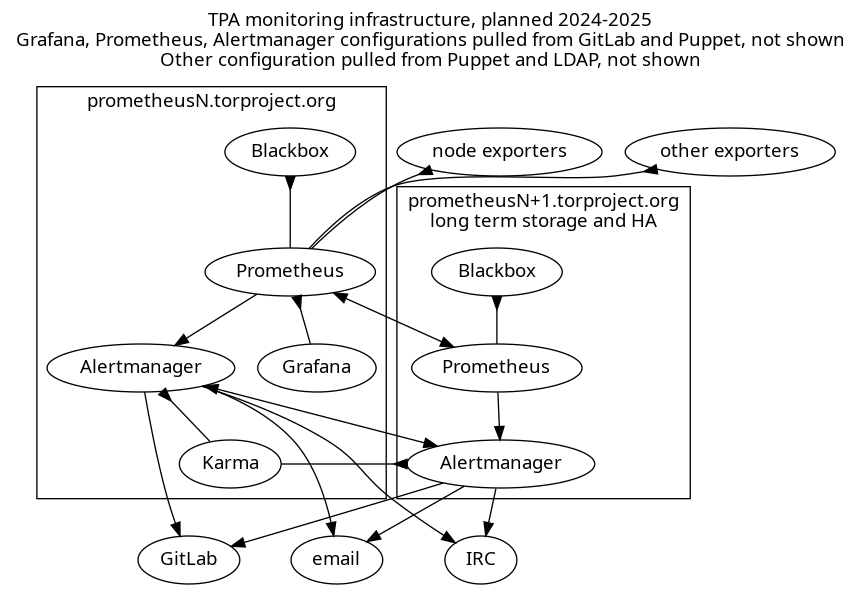
In #41641 (closed), we already implement some sort of self-monitoring, but that doesn't work if the monitoring server is completely unavailable. So we need a second server to monitor the first one. TPA-RFC-33 explored a few options for this, but the planned architecture goes like this:
The above shows a diagram of a highly available Prometheus server setup. Each server has its own set of services running:
Prometheus: both servers pull metrics from exporters including a node exporter on every machine but also other exporters defined by service admins, for which configuration is a mix of Puppet and a GitLab repository pulled by Puppet.
The secondary server keeps longer term metrics, and the primary server has a "remote read" functionality to pull those metrics as needed. Both Prometheus servers monitor each other.
blackbox exporter: one exporter runs on each Prometheus servers and is scraped by its respective Prometheus server for arbitrary metrics like ICMP, HTTP or TLS response times
Grafana: the primary server runs a Grafana service which should be fully configured in Puppet, with some dashboards being pulled from a GitLab repository. Local configuration is completely ephemeral and discouraged.
It pulls metrics from the local Prometheus server at first, but eventually, with a long term storage server, will pull from a proxy.
In the above diagram, it is shown as pulling directly from Prom2, but that's a symbolic shortcut, it would only use the proxy as an actual data source.
Alertmanager: each server also runs its own Alertmanager which fires off notifications to IRC, email, or (eventually) GitLab, deduplicating alerts between the two servers using its gossip protocol.
Karma: the primary server runs this alerting dashboard which pulls alerts from Alertmanager and can issue silences.
In there, the secondary server is a lightweight version of the first, pulling metrics from the first server instead of actual exporters.
It's unclear if that design is compatible with long-term retention (#40330) so it's possible we end up with a setup where both Prometheus servers are identical, with full copies of prometheus, alert manager, blackbox exporter, grafana, karma, etc. Then another server can be used for longer retention.
To experiment and research.
